PALS Results and Conclusion
Copyright © 1999, 2007 Kees Krijnen.
The objective of the experimental setup is to investigate the application of DSP in PALS experiments by means of implementation of a DSP microprocessor Spectrum Analyser, Autocorrelator and Energy Analyser.
The PC interface program implements a monitor to view the actual frame (oscilloscope function), the power (SA) or energy spectrum (AEA), and the autocorrelation function of power spectrum (SA) or integrated autocorrelation of actual frame (AEA). Another feature is to save what is displayed on screen. The applications are written in C542 algebraic assembler. The PC interface DOS program is written in C.
The same PC interface program is used for both applications. This means that for the Spectrum Analyser the Autocorrelation option displays the autocorrelation of the power spectrum to find significant frequencies - a limited number of power spectrum frames are computed. For the Autocorrelator and Energy Analyser application the Autocorrelation option displays the integrated autocorrelation of the aquisited frames, the Power Spectrum option is in fact the energy spectrum.
Results Spectrum Analyser
Figures 8 to 11 show the power spectrum of test signals from a Philips PM 5190 signal generator. Several positive sinoids are generated with a DC offset and applied to a light emmiting diode (LED). In this way the light detector is tested as well. The signals applied are the values listed, but the range of the power spectrum should be multiplied with 10/ 10.368 to get the actual value - see Experimental Setup chapter! The legend lists the signal applied (ADC value), the AC amplification and the power spectrum range.
|
Fig. 8 |
Fig. 9 |
|
Fig. 10 |
Fig. 11 |
The upper limit of the power spectrum range is half the sampling frequency. For above examples a 2kHz and 8kHz sampling frequencies are applied. Figs. 8. and 10. also show the second harmonics. The energy content, the Y-axis (ADC value), drops from 3000 at 250Hz to 90 at 2kHz due to the higher frequency (less photons per sample).
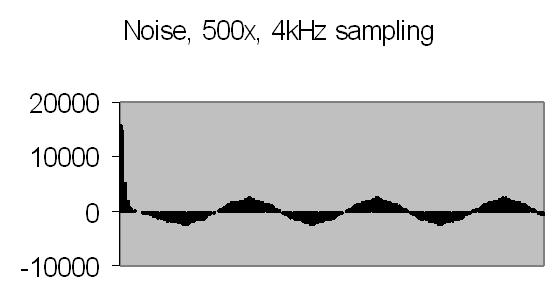
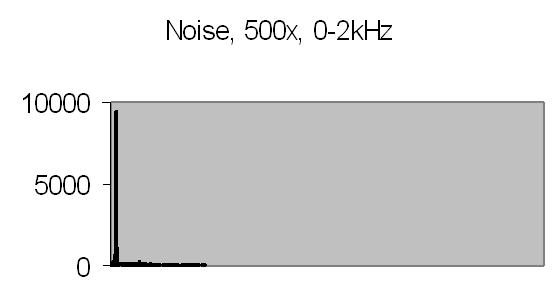
Figs. 12 and 13 show the 50Hz mains noise at an amplification of 500x - no light detected. Fig. 12 shows the power spectrum and fig. 13 the autocorrelation from four successive power spectrum frames. By autocorrelation of successive power spectra significant frequencies are found.
|
Fig. 12. Power spectrum |
Fig. 13. Spectra autocorrelation |
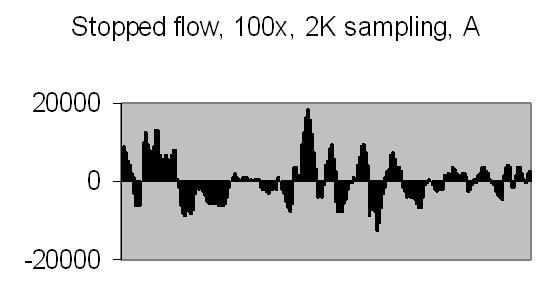
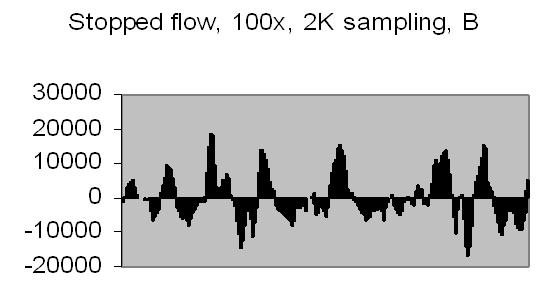
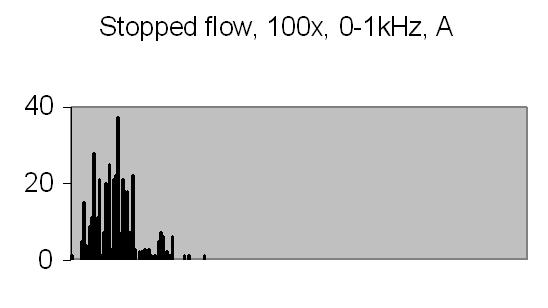
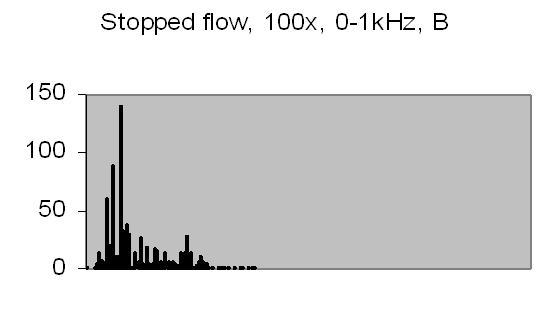
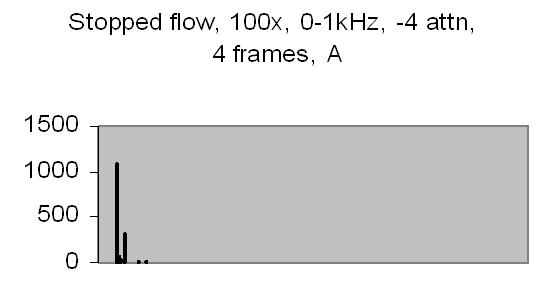
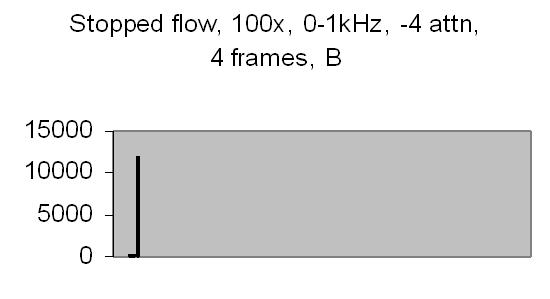
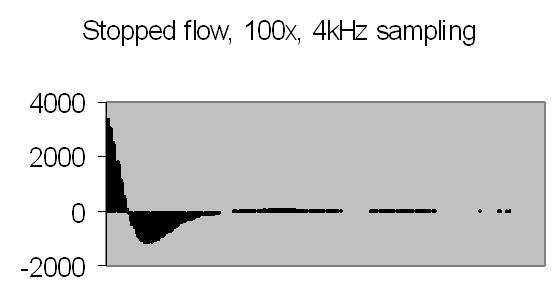
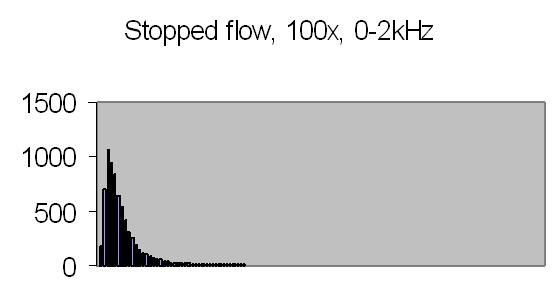
The test sample stopped flow signals, power spectra and autocorrelations are shown in figs. 14a, 14b, 15a, 15b, 16a and 16b. `A' and `B' are independent data aquisition frames.
|
Fig. 14a. Signal A |
Fig. 14b. Signal B |
|
Fig. 15a. Power spectrum A |
Fig. 15b. Power spectrum B |
|
Fig. 16a. Autocorrelation spectra A |
Fig. 16b. Autocorrelation spectra B |
Figs. 14a to 16b show in fact the background noise due to the Brownian movement of the suspended particles. It's a random signal, it varies from frame to frame. Autocorrelation of four successive spectra show some significant frequencies, but as more spectra frames are autocorrelated no significant frequencies are expected.
Figs. 14a and 14b make clear that the phototransistor is sensitive enough to detect the light scattering by interference from the random moving suspended particles. The sensivity depends on AC amplification factor (100x) and surface area of light detector. The surface area of applied light sensitive detector is approximately 25mm2. The internal amplification factor of the phototransistor is not known. The AC01 ADC has an input sensivity of ± 1.5V set. The signal figures also show that the dynamic range of ADC is properly used. The 14-bit ADC value in 16-bit 2nd complement format has limits from -32768 to 32767.
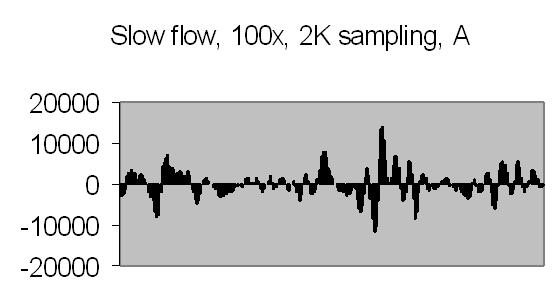
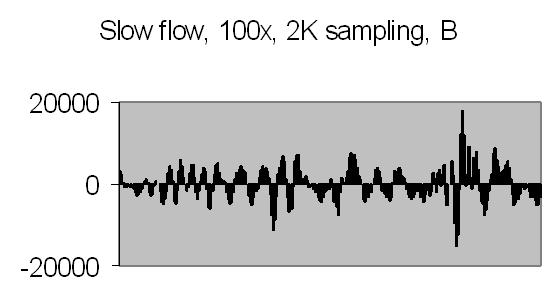
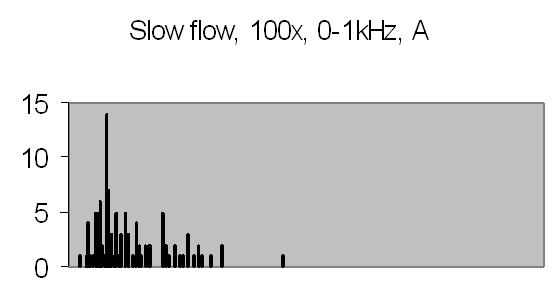
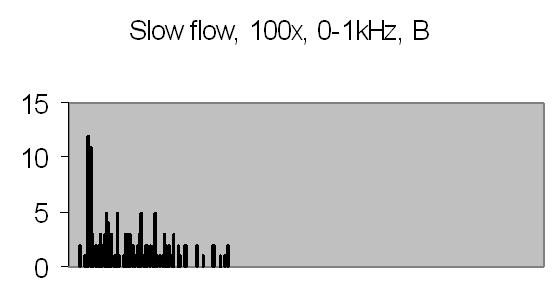
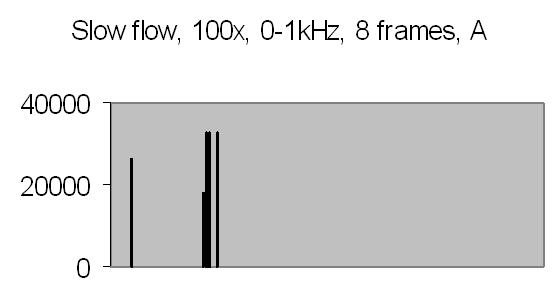
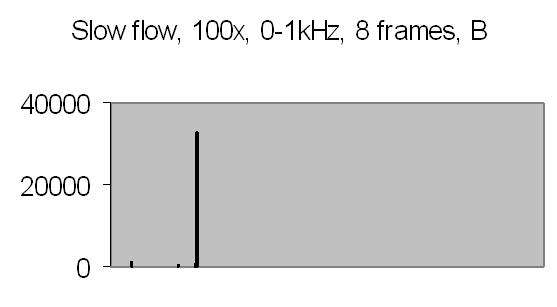
The test sample slow flow signals, power spectra and autocorrelation are shown in figs. 17a, 17b, 18a, 18b, 19a and 19b.
|
Fig. 17a. Signal A |
Fig. 17b. Signal B |
|
Fig. 18a. Power spectrum A |
Fig. 18b. Power spectrum B |
|
Fig. 19a. Autocorrelation spectra A |
Fig. 19b. Autocorrelation spectra B |
Figs. 19a and 19b compared to figs. 16a and 16b show that peaks found at 45-49Hz are caused by the Brownian movement of suspended particles. Fig. 19a peaks at 203-241Hz and fig. 19b peaks at 188-196Hz are peaks due to sinusoidal signal caused by suspended particles passing the dark and light bars of Young's fringes. Some peaks in the figs. of 19a and 19b are saturated, they are the result of multiplying eight power spectra. No attenuation is applied like figs. 16a and 16b (4 bit right shifting result after each multiplication).
It is difficult to avoid saturation. The energy content depends on the signal amplitude. This varies from frame to frame. Other concentrations or other samples will give different signal amplitudes, thus different power spectra. It will be difficult to set up a general attenuation and autocorrelation number of power spectra. The need for attenuation is a result from applying a fixed point DSP microprocessor - it has a limited dynamic range.
Another approach could be adding of all collected power spectra - saturation by adding will not happen as soon as saturation by multiplication. Unfortunately, this approach would also include all noise contributions. Autocorrelation is a tool to extract signal from noise.
Above signal figures are the first half (256 data points) from a frame of 512 data points. The power spectra are computed from a frame of 512 data points resulting a 256 points frame.
Results Autocorrelator and Energy Analyser
Figures 20a to 23b show the autocorrelation and energy spectra of test signals from a Philips PM 5190 signal generator - see results spectrum analyser - and a CEL213 random noise generator. The actual range of the energy spectra is 10/10.368 the listed value - see Experimental Setup chapter! The random noise signals are directly applied to the ADC input.
|
Fig. 20a. Autocorrelation |
Fig. 20b. Energy spectrum |
|
Fig. 21a. Autocorrelation |
Fig. 21b. Energy spectrum |
|
Fig. 22a. Autocorrelation |
Fig. 22b. Energy spectrum |
|
Fig. 23a. Autocorrelation |
Fig. 23b. Energy spectrum |
Figs. 20a to 23a show the continuous autocorrelation from a 256 data points signal frame. The Fourier transform - the energy spectrum - from the autocorrelation is given in figs. 20b to 23b. The latter result has 128 data points - half the data points of the autocorrelation frame.
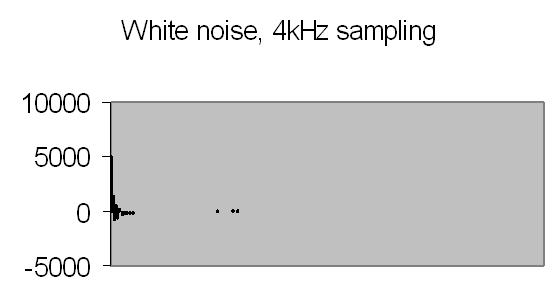
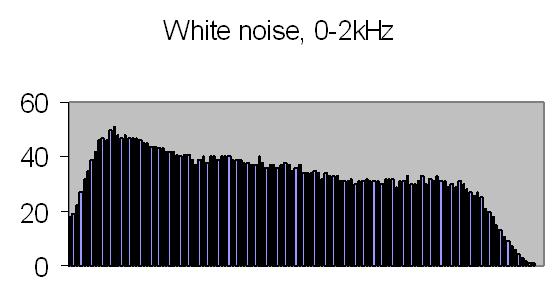
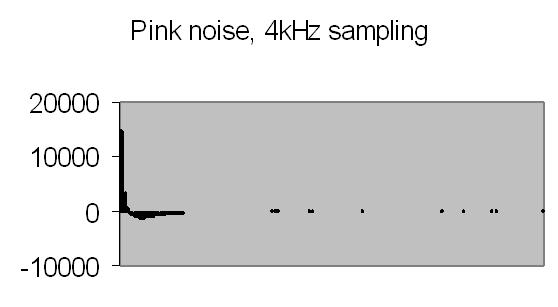
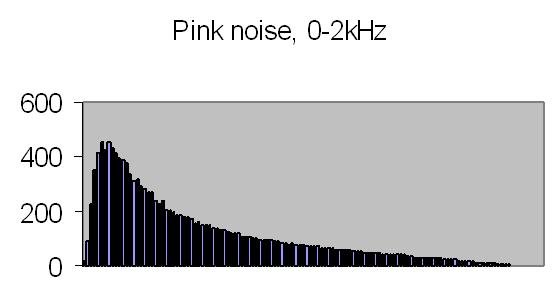
The white noise signal autocorrelation, fig. 22a shows a fast decay to zero, what is expected from a true random signal - there is very little similarity in time. The white noise energy spectrum (fig. 22b) is affected by the bandwith filter. The tableau should be flat, theory predicts a constant energy for all frequencies, but results are acceptable. The pink noise energy spectrum displays an expected exponential curve (fig. 23b). The density is proportional to 1/f.
Figs. 24a and 24b show the 50Hz mains noise at an amplification of 500x - no light detected.
|
Fig. 24a. Autocorrelation |
Fig. 24b. Energy spectrum |
Figs. 25a and 25b display the results from a stopped flow signal. The PCS theory predicts a decaying exponential curve for monosized particles. However, for a broader (gaussian) particle size distribution the autocorrelation of the scattered light displays a decaying cosine.
|
Fig. 25a. Autocorrelation |
Fig. 25b. Energy spectrum |
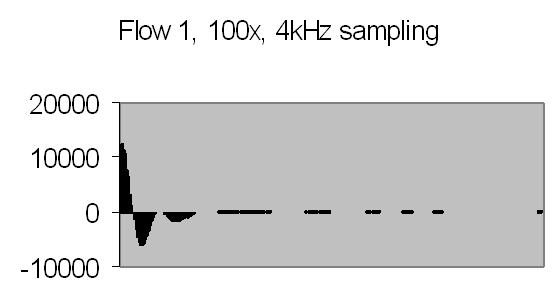
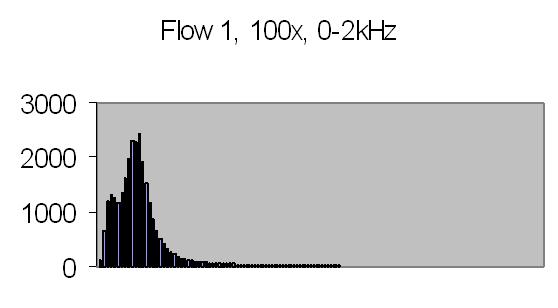
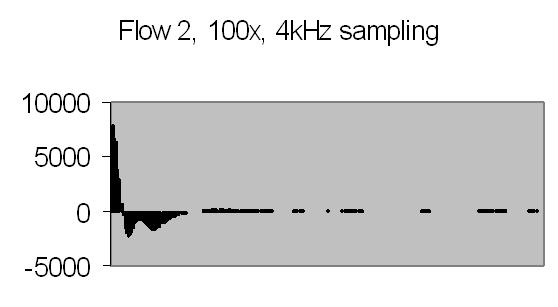
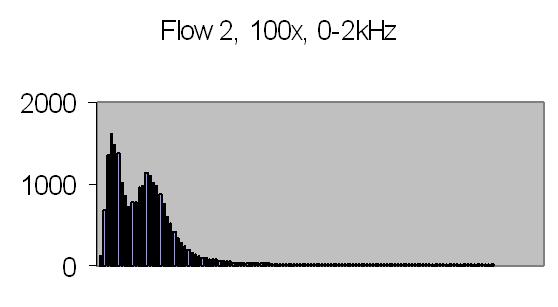
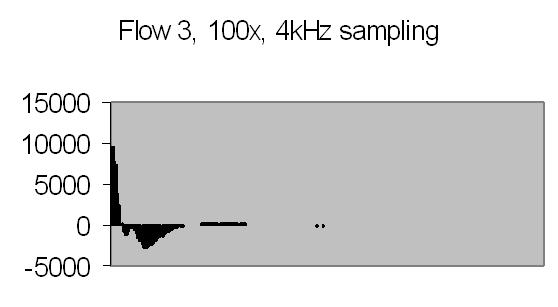
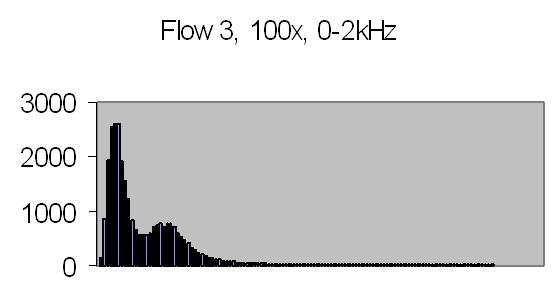
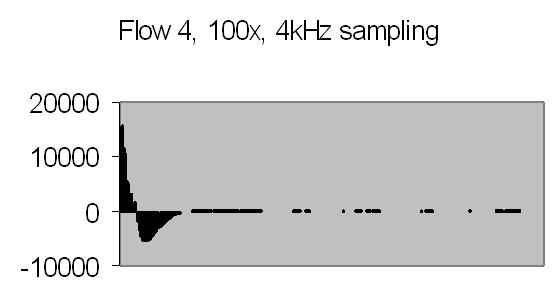
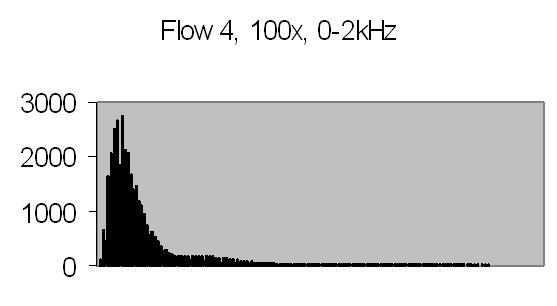
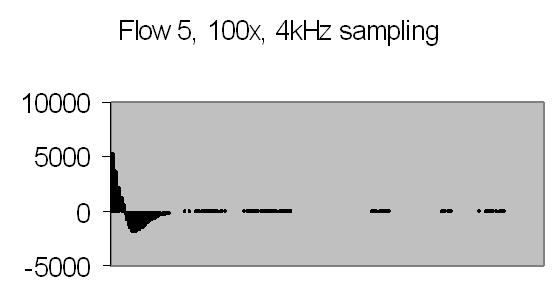
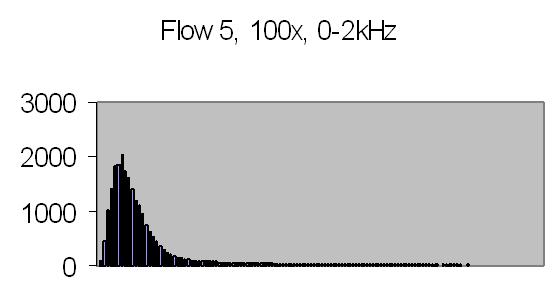
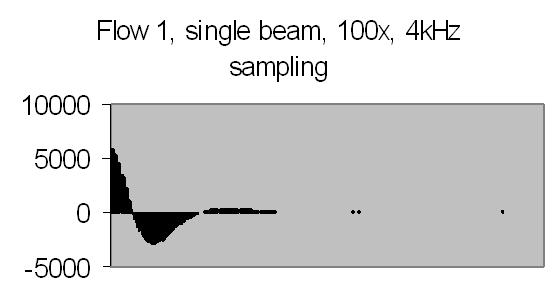
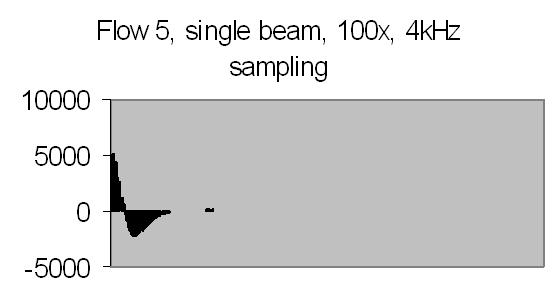
Figs. 26a to 30b show results from five different flows. Flow 1 is the slowest flow, increasing to the highest flow - flow 5. To be sure that the extra peak is produced by the passing of suspended particles through Young's fringes, a single beam result is collected as well - for example figs. 31a and 31b. A single beam result is exactly the same as a stopped flow result.
|
Fig. 26a. Autocorrelation |
Fig. 26b. Energy spectrum |
|
Fig. 27a. Autocorrelation |
Fig. 27b. Energy spectrum |
|
Fig. 28a. Autocorrelation |
Fig. 28b. Energy spectrum |
|
Fig. 29a. Autocorrelation |
Fig. 29b. Energy spectrum |
|
Fig. 30a. Autocorrelation |
Fig. 30b. Energy spectrum |
|
Fig. 31a. Autocorrelation |
Fig. 31b. Autocorrelation |
The energy spectra, like the power spectra, visualize the lower energy at higher frequencies. Figs. 29b and 30b show hardly any energy contribution from PALS at higher flows. Figs. 26b, 27b and 28b show two peaks: one from the Brownian movement, the second from PALS contribution. The latter peak is quite broad caused by fluctuations in uniform movement. It is difficult to produce a stable very slow flow by gravity.
The angle between the refracted crossing laser beams is 64.2 degree, Snell's law - 90 degree unrefracted (fig. 4). This angle results a spacing of ± 0.6 µm - equation (10). The computed particle velocity from flow 1 - a peak at ± 200Hz - becomes 0.012 cm/s. This is a very slow flow indeed! Air bubbles are not transported by such a slow flow. They collect in the tubing and glass capillary and cause the flow to stop sometimes. For ELS a more uniform movement is expected, thus resulting a narrow peak. Flow 2 shows a peak at ± 230Hz and flow 3 at ± 300Hz.
The sampling frequency of 4kHz is not randomly chosen. The autor is familiar with ELS equipment from Malvern Instruments Ltd, Malvern, UK. These ELS instruments apply a modulation frequency of 1000Hz to one of the mirrors (fig. 4). The modulation frequency gives an offset of 1000Hz to the result, enabling to find non-moving particles and determine the sign - positive or negative - of particle charge. The frequency shift found with these instruments will vary from 500Hz to 1500Hz. This fits precisely into the energy spectrum range - 0Hz to 2000Hz. Unfortunately, the lower energy contribution from higher frequencies prevents tests above 400Hz. However, it is proven that above DSP microprocessor autocorrelator application can cover the required range, providing 256 channels of autocorrelation. The limit depends on the FFT log2 requirement and sample frequency. The application blocks when 512 autocorrelation channels are set for 4kHz sampling frequency.
A typical measurement duration time for above autocorrelation experiments is 5 minutes. However, after 30 seconds the peak due to PALS is clearly visible. A longer duration time is taken to get a smooth autocorrelation function. Adding a 32-bit multiplicand from a 16x16-bit multiplication to the 64-bit autocorrelation channel causes unstable results just after start of measurement. The particle velocities computed are absolute. No calibration is required. The PALS measurement principle is based on physics. There are several ways to determine peaks within a (frequency) distribution.
Conclusion
The results are successful. It is possible to setup a DSP microprocessor autocorrelator to measure low uniform motion of suspended particles. The number of correlator channels is comparable to commercial autocorrelators and the required range is covered.
However, in comparison to commercial autocorrelators, presented DSP 16-bit fixed point µP autocorrelator can not be applied for particle sizing. It is too slow. It would be interesting to research faster DSP µPs to enhance performance to meet particle sizing requirements. At 20kHz sampling frequency, 64 autocorrelation channels can be set up with C542 DSP µP. This corresponds to a 50µs sample time. A 120MHz C549 µP runs three times as fast, reducing sample time to ± 17µs. The number of 64 autocorrelation channels is already sufficient for most particle sizing applications. For polydisperse distributions the available autocorrelations channels can be split up to provide different sample times and autocorrelation functions. Further enhancement could be achieved with DSP 32-bit µPs. From 10µs and shorter sample times a DSP µP autocorrelator would become interesting for particle size experiments.
The results have shown that - for PALS/ELS applications - a phototransistor can be used instead of a photomultiplier. There are a few systems on the market (e.g. Malvern Instruments Ltd.) which use phototransistors to measure ELS dynamic light scattering as replacement for PMTs. It is rarely seen. From a manufacturing point of view, the combination of a phototransistor system and a DSP µP autocorrelator reduces the hardware cost to a fraction (!) compared to hardware cost of a PMT system with a traditional hardware digital autocorrelator.
For further research some recommendations can be given:
- Repeat tests with ELS equipment, and measure ELS sample standards
- Second analog input of AC01 can be used to measure static light
scattering. This requires a parallel DC amplification of the
phototransitor analog output. This will enable to measure I, the
average intensity of scattered light.
By using an AC amplifier no information about average I is found. However, the advantage of AC amplification is that - equation (9) - the normalized offset `1' disappears and the autocorrelation measured is directly the required one. It also results the autocorrelation function decay to zero instead of to an offset. - If a modulation of one of the mirrors is required (fig.4), the ramp signal (e.g. 1000Hz) can be simultaneously generated by the analog output of AC01.
- The phototransitor surface area of 25mm2 is not required. The surface determines the light sensitivity, but in this application the pinholes (fig.4) used determine the minimum surface required. 1mm2 will already be sufficient. The phototransistor should have maximum sensitivity for the laser wavelength.
- No specifications are known of used phototransitor from UDT Sensors Inc. To maximize sensitivity it is very likely that internal amplifier has been designed as a CCD (charged coupled device) circuit, integrating received energy. Such a CCD circuit could be designed for a separate photovoltaic sensor allowing greater flexibility in amplification and filtering.
The described PALS experiment was done in 1999. Today, it is possible to design a digital correlator into a single FPGA (Field Programmable Gate Array) IC device.


